헤어살롱의 감각마케팅이 살롱선택속성과 고객만족에 미치는 영향
The Effect of Sensory Marketing on Selection Factors and Customer Satisfaction
Article information
Trans Abstract
The purpose of this study is to find out the importance of marketing that stimulates consumers' five senses and to further study the factors that consumers choose salons to help them find a developmental direction to enhance customer satisfaction. As for the subject of this study, a total of 350 questionnaires were distributed, and 323 of them were retrieved and statistical data was obtained with 312 valid questionnaires. SPSS 22.0 was used to analyze the collected data. Analytical analysis was carried out on the data in the form of frequency analysis, factor analysis, reliability analysis, and regression analysis. As a result, first, The tactile, palate, auditory, and visual areas, excluding olfactory areas, which are sub-factors of sensory marketing, were found to partially affect saloon selectivity (brand, internal and external attributes). Second, Sensory marketing also partially affected customer satisfaction, recommendation, and revisitability, of which auditory areas affected all factors. Through this study, the importance of sensory marketing and marketing strategy that increases positive customer response will be helpful.
I. 서 론
소비자의 경제수준의 향상으로 인간의 가치부여의 기회가 늘어나면서 개인의 성향은 더욱 다양해지고 제품이나 서비스를 소비하려는 욕구도 커지고 있다. 또한 아름다움의 인식변화에 따라 미용은 사회·문화적 유행이 다양해지고 고급화되면서 양적·질적으로 성장하고 있으며 헤어, 메이크업, 피부미용, 네일 등으로 다양하게 세분화되며 전문화되고 있다(Kim, 2013). 시장에는 끊임없이 새로운 제품이 나오며 소비자가 새로운 제품에 익숙해질수록 소비성향은 잠재적 소비성향에서 적극적 소비성향으로 태도가 변하게 된다(Lee, 2014). 소비자를 확보하는 중요한 요인 중 하나인 오늘날의 마케팅은 제품과 서비스를 단순히 홍보하고 공유하는 것뿐만 아니라 소비자의 마음까지 이해하고, 소비자 개인의 감정을 표출시킬 수 있도록 돕는 역할까지 수행하고 있다(Jeon, 2005). 소비자가 제품과 서비스 및 점포 등을 선택하는 기준은 개개인의 성향에 따라 다르겠지만 습관적 구입제품은 단순한 과정을 통해 소비하는 반면 경험이 없거나 위험도가 높은 새로운 제품 및 서비스의 소비과정에서는 점포를 선택하는 과정이 매우 복잡해진다(Kim, 2013). 그러므로 점포의 선택을 촉진시키기 위해서는 감각마케팅을 이용하여 전략적인 목표를 세울 필요가 있다. 첫째로 브랜드와 제품을 통해 소비자와 차별적인 소통 공간을 마련해야하고, 둘째로 고객의 감각적 호소를 이해하고 동기화 시키며, 셋째로 고객이 점포를 선택할 가치를 제공해야한다(Lee, 2013). 기업은 신규 고객의 확보와 단골 고객의 유지를 위해 내적·외적 자원을 효율적으로 관리하고 다양한 마케팅 전략을 수립하려고 할 것이다. 또한 내적·외적 요인뿐만 아니라 점포(브랜드) 이미지나 점포의 특성이 소비자의 욕구를 충족시킬수록 소비자는 점포에 대한 긍정적인 태도를 갖게 되며 소비까지 이어진다(Jo, 2003).
소비자들이 어떤 구매행동을 갖고 어떤 점포를 선택할 것인지를 파악하고자 하는 노력들이 많이 연구되어져 왔으나 헤어살롱 점포 선택속성 중 각각의 요인에 대한 분석이 부족하고 감각마케팅 분야와 헤어살롱 서비스 분야를 연계시키는 연구는 미비한 실정이다.
이에 본 연구는 서울, 경기, 강원 지역의 소재하는 헤어살롱을 이용하는 소비자들을 대상으로 감각마케팅이 살롱선택속성과 고객만족에 미치는 영향에 대해 실증적으로 분석하여 감각마케팅의 중요성을 파악하고 소비자가 살롱을 선택하는 요인에 대해 더 연구하여 고객만족을 높이는 발전적 방향을 모색하는데 도움이 되고자 한다.
II. 이론적 배경
1. 감각마케팅
감성마케팅은 상품의 가치보다 개인의 감성에 어울리거나 개인이 좋아하는 정보나 자극을 통해 소비자의 외적 감각반응을 일으켜 소비경험을 즐겁게 해주며 이를 통해 소비자를 감동시키는 것이라 할 수 있다. 사람마다 경험이 다르고 감성을 자극할 수 있는 것을 각기 다르기 때문에 고객과 기업, 고객과 제품 사이에 감정의 교류를 만들어내는 것이 중요한 마케팅 전략일 것이다(Yoo, 2006). 감성마케팅은 감각마케팅, 감동마케팅, 문화마케팅 3가지 영역으로 나뉘며(Kim, 2013), 본 연구에서는 감각마케팅을 독립변수로 설정하여 알아보고자 하였다.
감각마케팅은 인간의 오감의 요인에 따라 나뉘는데, 미각적요인(미각 마케팅)은 소비자에게 먹는 것을 학습시키는 것이 가능하며, 미각을 이용한 느낌 전달을 통해 제품들을 상기시켜 욕구를 충족시킬 수 있다(Lee, 2019). 촉각적 요인(촉각 마케팅)은 피부에 작용하는 중량감이나 압박, 접촉, 마찰 등의 역학적 자극을 감지하는 기능을 이용하여 소비자가 제품을 직접 느껴보고 구매할 수 있다(Leem, 2015). 시각적 요인(시각 마케팅)은 색채에 민감하게 반응하는 인간의 감성을 자극해 강한 구매욕을 상승시킬 수 있고, 향기를 이용하여 장소나 상황 등을 자연스럽게 연상시켜 구매 욕구를 높이는 후각적 요인(후각 마케팅)이 있다(Lee, 2014). 청각적 요인(청각 마케팅)은 이미지와 감성에 따라 달라지는 가치와 만족감, 안락감을 제공하는 중요한 매개체 역할을 하며, 감성을 자극하여 구매에 영향을 미친다(Lee, 2019). 이러한 요소들을 통해 감성을 자극하여 마케팅 효과를 높이는 방법을 감각 마케팅이라 한다.
2. 살롱선택속성
소비자의 중요한 의사결정 중 하나는 상품이나 서비스를 구매할 점포를 선택하는 것이다. 점포를 선택하기 위한 의사결정 과정에서 점포에 대한 소비자의 욕구 또는 기대는 점포를 평가하는 기준이 되며, 소비자는 자신만의 평가적 기준과 지각적 특성을 비교함으로써 구매를 위한 점포를 결정하게 된다(Cheon, 2004).
살롱선택은 살롱 이미지, 가격, 제공 서비스, 입지 등에 따라 다양하고 여러 단계를 거치는 의사결정 과정이라고 할 수 있으며(Silverstein & Fiske, 2003), 이 과정에서 소비자의 지각, 쇼핑성향, 라이프 스타일 등은 소비자들이 살롱을 선택하는데 많은 영향을 준다(Ko & Ko, 2010). 고객이 어떻게 살롱을 선택하는지, 살롱 내에서 어떤 결정을 하는지를 이해하는 것이 마케팅 전략의 기본이며 필수적인 요소라고 할 수 있다(Lee et al., 2012).
선택속성의 구성요소에는 외적속성은 위치(Park, 2016), 접근성, 물리적 환경, 부대시설(Kim, 2013)이 있으며 내적속성은 매장 분위기, 전문적 기술, 인적 서비스(Park, 2016), 제품요인, 점포 분위기(Kim, 2013), 브랜드 속성은 점포의 명성(Kim, 2016), 점포의 인지도, 평판, 이미지(Jeong, 2011) 등이 있다.
3. 고객만족
고객만족이란 고객의 기대를 충족하는 것을 의미하며, 고객이 서비스나 상품을 구매하기 전에 갖는 기대와 구매한 후의 성과를 평가하는 것이다(Kang, 2009). 고객만족은 모든 기업이 서비스를 제공할 시 고려해야 할 중요한 요소로 기업 간 경쟁이 심화될수록 더욱 부각되고 있다(Choi, 2007). 김준호, 이동진(2004)의 연구에서는 고객만족과 불만족을 <Table 1>과 같이 정리하였다.

Positive and Negative Discordance
또한 고객만족은 고객의 기대와 요구를 만족시킨 기업에 대한 긍정적인 경험이며, 소비자는 이 경험을 통해 제품이나 서비스를 재구매하거나 만족했던 곳을 재방문할 뿐만 아니라 긍정적인 구전을 통해 또 다른 고객에게 추천할 수 있다(Kang, 2004). 본 연구에서는 고객만족의 구성요소를 만족도(Kim & Park, 2019)와 추천의도(Kim, 2019), 재방문의도(Lee, 2007)로 구분하여 연구하였다.
III. 내용 및 방법
1. 조사대상 및 분석방법
본 연구의 조사대상은 서울, 경기도, 강원도에 소재한 헤어살롱을 이용하는 소비자이다. 이들을 대상으로 자기기입식 설문조사를 실시하여 자료를 수집하였다. 본 조사는 2020년 7월 1일부터 7월 31일까지 실시되었다. 총 350부의 설문지가 배포되었고 그 중 323부의 설문지가 회수되었으며 312부의 유효 설문지가 최종분석 자료로 사용되었다.
수집한 자료를 분석하기 위해 SPSS 22.0이 사용되었다. 자료분석에 사용된 방법은 다음과 같다.
첫째, 조사대상의 일반적 사항을 알아보기 위해 빈도분석이 사용되었다.
둘째, 감각마케팅, 살롱선택속성, 고객만족의 타당성 및 신뢰성을 알아보기 위해 요인분석(주성 분 분석, 베리멕스 사용)과 신뢰도분석이 사용되었다.
셋째, 감각마케팅이 살롱선택속성과 고객만족에 미치는 영향을 알아보기 위해 회귀분석이 사용 되었다.
2. 측정도구
본 연구를 위해 사용된 측정도구의 내용은 총 4개의 항목으로 구성하였다. 일반적 특성은 Sung(2014), Kim(2019)의 설문지를 참고하여 성별, 연령, 결혼 여부, 학력, 직업, 월 소득 총 6문항으로 구성하였다. 감각마케팅은 Yoo(2006), Moon(2010), Lee(2017)의 설문지를 참고하여 시각, 미각, 청각, 후각, 촉각등 다섯 가지 영역을 연구자가 재구성하여 총 20문항으로 하였다. 살롱선택속성은 Yoo(2015), Cho(2019), Han(2010)의 설문지를 참고하여 내적속성, 외적속성, 브랜드속성 등 총 12문항으로 연구자가 재구성하였다. 고객만족도는 Cho(2007), No (2012), Moon(2013)의 설문지를 참고하였고, 추천의도와 재방문 의도는 Yang(2010), Kim(2011), Kim(2018), Kim(2019)의 설문지를 참고하여 총 13문항으로 연구자가 재구성하였다.
IV. 결과 및 고찰
1. 조사대상의 일반적 사항
조사대상의 일반적 사항을 알아보기 위해 빈도분석을 실시한 결과는 다음 <Table 2>와 같다.
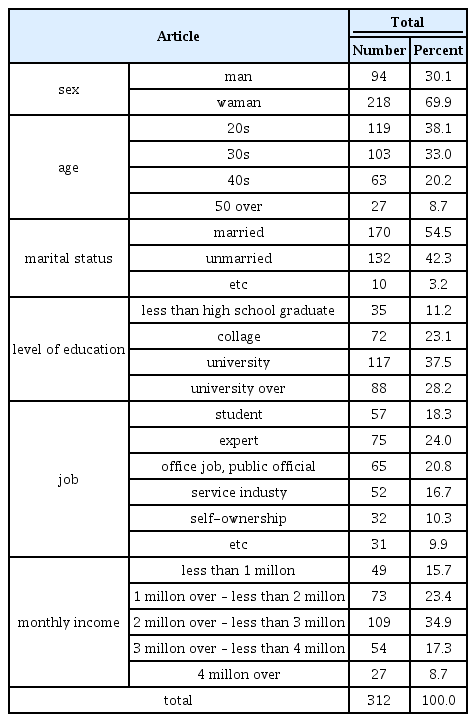
Characteristics of population statistics (n=312명, %)
성별은 여성 69.9%, 남성 30.1%로 여성이 높게 나타났다. 연령은 20대가 38.1%로 가장 높게 나타났고, 다음은 30대 33.0%,40대 20.2%, 50세 이상 8.7% 순이었다. 결혼여부는 미혼이 54.5%로 가장 높게 나타났고, 다음은 기혼 42.3%, 기타 3.2% 순이었다. 학력은 대학교(재학생포함)이 37.5%로 가장 높게 나타났고, 다음은 대학원이상(재학생포함) 28.2%, 전문대(재학생포함) 23.1%, 고졸이하 11.2% 순으로 나타났다. 직업의 경우 전문기술직이 24.0%로 가장 높게 나타났고, 다음은 사무직 및 공무원 20.8%, 학생 18.3%, 서비스업 16.7%, 자영업 10.3%, 기타 9.9% 순이었다. 월 평균 소득을 알아본 결과 200만원에서 300만원 미만이 34.9%로 가장 높게 나타났고, 다음은 100만원에서 200만원 미만 23.4%, 300만원에서 400만원 미만 17.3%,100만원 미만 15.7%, 400만원 이상 8.7% 순이었다.
2. 감각마케팅, 살롱선택속성, 고객만족의 타당성 및 신뢰성
1) 감각마케팅의 타당성 및 신뢰성
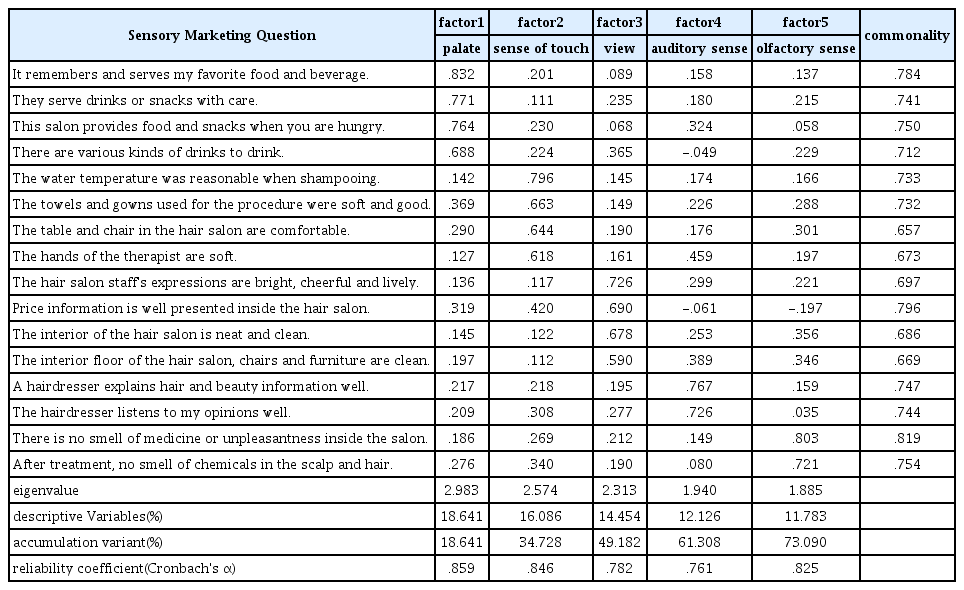
감각마케팅 문항의 타당성을 검증하기 위해 요인분석을 한 결과 <Table 3>과 같이 다섯 가지의 요인이 도출되었다. Bartlett의 단위행렬 점검 결과 X2=2665.649(df=120, Sig=.0000), KMO=0.917로 나타났으며, 공통성은 0.657 이상으로 나타났다. 첫 번째 요인은 ‘미각영역’ 요인으로 요인적재값은 0.688~0.832로 나타났으며, 고유값은 2.983, 분산설명비율은 18.6%로 나타났다. 두 번째 요인은 ‘촉각영역’ 요인으로 요인적재값은 0.618~0.796로 나타났으며, 고유값은 2.574, 분산설명비율은 16.1%로 나타났다. 세 번째 요인은 ‘시각영역’ 요인으로 요인적재값은 0.590~0.726로 나타났으며, 고유값은 2.313, 분산설명비율은 14.5%로 나타났다. 네 번째 요인은 ‘청각영역’ 요인으로 요인적재값은 0.726~0.767로 나타났으며, 고유값은 1.940, 분산설명비율은 12.1%로 나타났다. 다섯 번째 요인은 ‘후각영역’ 요인으로 요인적재값은 0.721~0.803로 나타났으며, 고유값은 1.885, 분산설명비율은 11.8%로 나타났다.
Feasibility and Reliability of Sensory Marketing
요인분석 결과 도출된 다섯 가지 요인으로 전체 분산의 73.1%가 설명되는 것으로 나타났다.
신뢰성을 검정하기 위해 신뢰도 분석을 한 결과, 신뢰도 계수인 Cronbach's α는 0.761~0.859 으로 높게 나타났다.
2) 살롱선택속성의 타당성 및 신뢰성
살롱선택속성 문항의 타당성을 검증하기 위해 요인분석을 한 결과 <Table 4>와 같이 세 가지의 요인이 도출되었다. Bartlett의 단위행렬 점검 결과 X2=1887.925(df=55, Sig=.0000), KMO=0.835로 나타났으며, 공통성은 0.491이상으로 나타났다.

Feasibility and Reliability of Selection Factors for Hair Salons
첫 번째 요인은 ‘브랜드속성’ 요인으로 요인적재값은 0.876~0.927로 나타났으며, 고유값은 3.550, 분산설명비율은 32.3%로 나타났다. 두 번째 요인은 ‘내적속성’ 요인으로 요인적재값은 0.655~0.809로 나타났으며, 고유값은 2.406, 분산설명비율은 21.9%로 나타났다. 세 번째 요인은 ‘외적속성’ 요인으로 요인적재값은 0.473~0.815로 나타났으며, 고유값은 1.779, 분산설명비율은 16.2%로 나타났다.
요인분석 결과 도출된 세 가지 요인이 전체 분산의 70.3% 이상 설명되고 있는 것으로 나타났다.
신뢰성을 검정하기 위해 신뢰도분석을 한 결과, 신뢰도 계수인 Cronbach's α는 0.675~0.944로 높게 나타났다.
3) 고객만족의 타당성 및 신뢰성
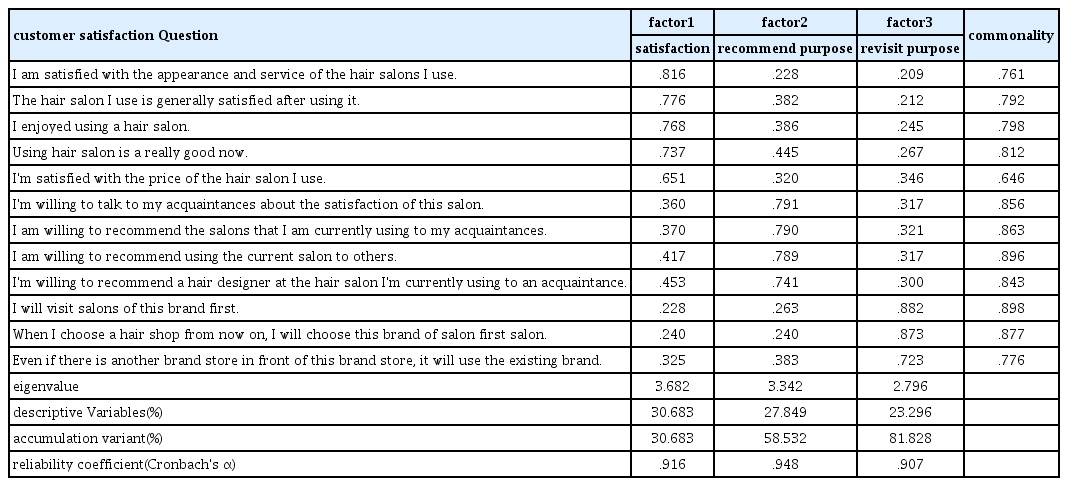
고객만족 문항의 타당성을 검증하기 위해 요인분석을 한 결과 <Table 5>와 같이 세 가지 요인이 도출되었다. Bartlett의 단위행렬 점검 결과 X2=3575.740(df=66, Sig=.0000), KMO=0.940로 나타났으며, 공통성은 0.646이상으로 나타났다.
Feasibility and Reliability of Customer Satisfaction
첫 번째 요인은 ‘만족도’ 요인으로 요인적재값은 0.651~ 0.816로 나타났으며, 고유값은 3.682, 분산설명비율은 30.7%로 나타났다. 두 번째 요인은 ‘추천의도’ 요인으로 요인적재값은 0.741~0.791로 나타났으며, 고유값은 3.342, 분산설명비율은 27.8%로 나타났다. 세 번째 요인은 ‘재방문의도’ 요인으로 요인적재값은 0.723~0.882로 나타났으며, 고유값은 2.796, 분산설명비율은 23.3%로 나타났다.
요인분석 결과 도출된 세 가지 요인이 전체 분산의 81.8%이상 설명되고 있는 것으로 나타났다.
신뢰성을 검정하기 위해 신뢰도분석을 한 결과, 신뢰도 계수인 Cronbach's α는 0.907~0.948로 높게 나타났다.
3. 감각마케팅이 살롱선택속성에 미치는 영향
감각마케팅이 살롱선택속성에 미치는 영향을 알아보기 위해 회귀분석을 한 결과는 <Table 6>과 같다. 살롱선택속성의 하위요인인 ‘브랜드속성’은 감각마케팅의 ‘미각영역’과, ‘촉각영역’에 의해 13.9% 설명되며 독립변수가 종속변수에 정적 영향을 미치는 것으로 나타났다. 이는 미각영역, 촉각영역이 높아질수록 브랜드속성도 높아지고 있음을 의미한다. ‘내적속성’은 ‘촉각영역’, ‘청각영역’, ‘시각영역’에 의해 7.4% 설명되며 독립변수가 종속변수에 정적 영향을 미치는 것으로 나타났다. 이는 촉각영역, 청각영역, 시각영역이 높아질수록 내적속성도 높아지고 있음을 의미한다. ‘외적속성’은 ‘촉각영역’, ‘미각영역’,‘청각영역’, ‘시각영역’에 의해 18.3% 설명되며 독립변수가 종속변수에 정적 영향을 미치는 것으로 나타났다. 이는 촉각영역, 미각영역, 청각영역, 시각영역이 높아질수록 외적속성도 높아지고 있음을 의미한다.
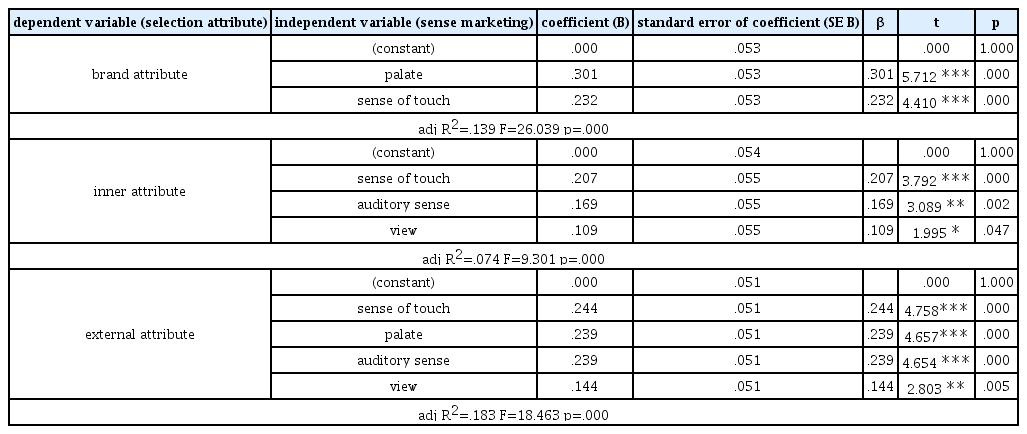
The Effect of Sensory Marketing on Selection Factors for Hair Salons
Lee(2014)은 영화관의 감각을 이용한 마케팅 요소들이 브랜드 이미지에 부분적으로 영향을 미친다고 하였다. Hill, Dan (2004)은 오감은 고객과의 신뢰성이 구축되기 때문에 마케팅을 위한 전략으로 중요하고 감각을 이용한 이미지는 고객에게 큰 긍정적 효과를 발휘하며 감성적인 반응을 유도할 수 있다고 하였다. Lee(2013)는 플래그십 스토어에서 제공하는 오감을 이용한 체험은 일차적으로는 브랜드의 평판, 인지도, 가격 등을 판단하는데 영향을 미치고 여기에 감각을 자극하는 요소가 더해지면 그 브랜드에 대한 이미지를 더 긍정적으로 기억하고 구매하는데도 직접적 영향을 끼친다고 하였다. 이는 본 연구결과를 지지해주므로 고객의 만족감과 구매를 자극하기 위해서는 오감을 이용한 전략적 마케팅을 통해 긍정적인 브랜드 이미지를 구축하는 방안을 모색해야 할 것이다.
4. 감각마케팅이 고객만족에 미치는 영향
감각마케팅이 고객만족에 미치는 영향을 알아보기 위해 회귀분석을 한 결과는 <Table 7>과 같다. 고객만족의 하위요인인‘만족도’는 감각마케팅의 ‘청각영역’, ‘촉각영역’, ‘시각영역’,‘후각영역’, ‘미각영역’에 의해 41.6% 설명되며 독립변수가 종속변수에 정적 영향을 미치는 것으로 나타났다. 이는 청각영역, 촉각영역, 시각영역, 후각영역, 미각영역이 높아질수록 만족도도 높아지고 있음을 의미한다. ‘추천의도’는 ‘청각영역’,‘시각영역’에 의해 12.4% 설명되며 독립변수가 종속변수에 정적 영향을 미치는 것으로 나타났다. 이는 청각영역, 시각영역이 높아질수록 추천의도도 높아지고 있음을 의미한다. ‘재방문의도’는 ‘미각영역’, ‘촉각영역’, ‘청각영역’에 의해 9.7% 설명되며 독립변수가 종속변수에 정적 영향을 미치는 것으로 나타났다. 이는 미각영역, 촉각영역, 청각영역이 높아질수록 재방문 의도도 높아지고 있음을 의미한다.
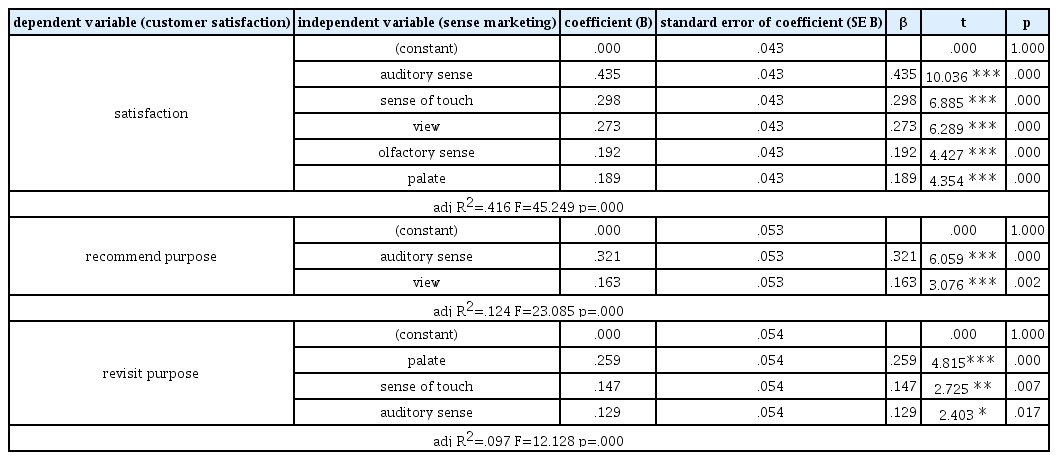
The Effect of Sensory Marketing on Customer Satisfaction
Hwang & Kim(2008)은 서비스 환경의 품질이 긍정적으로 지각될수록 고객 만족도가 높아지고 만족도가 높아질수록 재방문 또한 높아진다고 하였다. 또 레스토랑의 물리적 환경지각이 감정반응, 고객만족 그리고 재구매 의도 및 구전의도에 미치는 영향연구(Kim et al., 2009)에서도 유의미한 영향을 미치는 것으로 나타났다. No(2009)는 지각된 서비스품질은 구매의도, 재구매의도, 구전의도를 높이는 중요한 요인이라고 하였다. 또 호텔 일식 레스토랑의 감각마케팅 요소가 고객감정반응과 구전의도에 미치는 영향(Lee, 2019)에서 감각마케팅요소가 구전의도에 영향을 미치는 요인으로 나타났다. 이는 본 연구결과를 지지해주므로 소비자의 욕구를 충족시킬 수 있는 감각 마케팅을 높이는 상징적인 요소와 고객 지향적인 마케팅 전략에 집중하면 소비자의 만족도, 추천의도, 재방문의도에도 긍정적인 영향을 미칠 것으로 사료된다.
V. 결 론
본 연구는 서울, 경기, 강원 지역에 헤어살롱을 이용한 경험이 있는 소비자를 대상으로 감각마케팅과 살롱선택속성, 고객만족의 관계를 알아봄으로써, 감각마케팅의 중요성을 인식하고 고객만족을 높여 미용서비스 기업의 발전을 위한 마케팅 방안을 모색해 보고자 실시하였다.
본 연구를 통한 시사점은 다음과 같다. 첫째, 감각마케팅의 하위요인인 후각영역을 제외한 촉각, 미각, 청각, 시각 영역이 부분적으로 살롱선택속성(브랜드·내적·외적속성)에 영향을 미치는 것으로 나타났다. 이 중 촉각영역은 살롱선택속성의 모든 하위요인에 영향을 주었으며 이는 시술자가 고객에게 부드러운 손길로 시술하여 편안함을 주고 피부에 닿는 수건과 가운 등의 촉감과 물의 온도를 적절히 하는 것이 중요할 것으로 보인다. 또 고객이 필요로 할 때 적절한 음료, 간식을 다양하게 제공하는 것이 중요하며, 고객에게 안락한 의자를 제공, 헤어살롱을 청결하게 유지하는 것이 고객이 헤어살롱을 구매결정 시 긍정적인 영향을 줄 것이다. 후각영역은 미용서비스가 약품을 이용한 서비스이므로 소비자가 다른 감각영역에 비해 비교적 만족하지 못해도 살롱을 선택하는 데 있어서 큰 영향을 끼치지 않는 것으로 판단된다. 둘째, 고객 만족도와 추천의도, 재방문의도에도 감각 마케팅이 부분적으로 영향을 미쳤는데, 이 중 청각영역은 모든 요인에 영향을 미쳤다. 감각마케팅의 요인에는 모두 인적서비스가 포함되어 있는데, 이는 미용서비스의 직업 특성상 고객과 종사자의 대면으로 서비스의 교환이 이루어지기 때문에 청각영역이 중요하다고 보인다. 종사자의 표정, 고객에 대한 자발적인 관심과 주의를 기울이고, 고객의 말을 경청하고 고객이 서비스를 받을 때 필요한 정보를 잘 전달해주는 것이 고객의 기대와 요구를 만족시키는 방법이라고 판단된다.
인간은 제품이나 서비스를 확실히 판단하기 위해 감각에 의존해 감정을 자극시키기 때문에 감각마케팅을 전략적으로 이용해야 할 것이다. 또한 고객은 단순히 헤어스타일의 변화만을 바라고 살롱을 방문하는 것이 아니라 다양한 서비스를 경험하기 때문에 고객마다 각자의 기준과 욕구가 다를 것이며 더 예민한 감각을 파악하여 기대와 욕구에 만족을 줄 수 있도록 연구해야할 것이다. 감정자극에 긍정적 경험을 준 살롱을 통해 의사결정과정에 호의적인 태도를 갖게 되며 제품이나 서비스를 재구매하거나 살롱을 재방문하여 단골 고객이 될 수 있으며 다른 사람에게 구전의도가 높아지면 신규고객도 확보할 수 있을 것이다.
본 연구는 설문조사 시 서울, 경기, 강원 지역의 소비자들로 한정되어 있어 일반화하기는 한계가 있으며, 다양한 지역의 소비자로 표본을 수집하여 연구할 필요성이 있다. 또한 고객의 사회적 경험에 따라 더 중요하게 생각하거나 자극받는 감각이 다르므로 더 다각적으로 연구를 진행, 보완한다면 고객의 오감을 조화롭게 만족시키고 긍정적인 고객반응을 높이는 마케팅전략 수립에 도움이 될 것으로 사료된다.