바버샵 서비스스케이프가 고객만족 및 재방문의도에 미치는 영향

Effect of Barber Shop Servicescape on Customer Satisfaction and Revisit Intention

Article information

J Korean Soc Cosmetol. 2021;27(5):1206-1218
Publication date (electronic) : 2021 October 31
doi : https://doi.org/10.52660/JKSC.2021.27.5.1206
Professor, Dept. of Beauty Arts, Jeonghwa Arts University
석유나,
정화예술대학교 미용예술학부 미용전공, 교수
*Corresponding author: You-Na Seok Tel : +82-2-6916-3198 E-mail : syn0912@naver.com
Received 2021 July 8; Revised 2021 August 12; Accepted 2021 September 27.

Trans Abstract

The purpose of this study was to investigate the effect of Barber Shop servicescape on customer satisfaction and revisit intention. After setting the barbershop servicescape factors as aesthetics, convenience, cleanliness, and air-conditioning environment, the relationship between the barbershop's servicescape evaluation and customer satisfaction and revisit intention was verified. The research results are as follows. First, the age of users is in their 30s and 40s, accounting for 69% of the total, with college graduates accounting for half of them, and office workers were the most common. Married people earning less than 3 to 4 million won also accounted for the majority. Second, the customer's use of Barber Shop Servicescape showed the highest number of visits from 8 to 12 weeks, and the frequency of visits by those in their 30s and younger was high once every 4 weeks. In the case of single people, the number of visits more than once every 4 weeks was relatively higher than that of married people, and the reason for using the barber shop was to maintain style. Third, as a result of examining the tangible, responsive, and reliable dimensions of Barber Shop users, the level evaluation of Barber Shop servicescape by age was more meaningful than other areas in all areas (esthetics, convenience, cleanliness, air-conditioning environment) in their 30s and 40s. level was highly rated. Fourth, as a result of examining the effect of Servicescape on customer satisfaction and re-visit intention, the correlation between Barber Shop Servicescape evaluation and customer satisfaction was (.781) and that with re-visit intention (.618) showed a significant correlation. As a result of the evaluation of Barber Shop Servicescape by age, it was found that those in their 30s and 40s evaluated more significantly than other age groups in all areas. By educational background, the most significant results were found among those who graduated from a junior college and those who earned 5 million won or more. By marital status, it was found that the unmarried group evaluated significantly, and by the type of barber shop, it was found that the franchise was more significant than the individual shop. When looking at the effect of Barber Shop servicescape on customer satisfaction and revisit intention, the effect on customer satisfaction was R=.781 and the effect on revisit intention was R=.618, indicating that the effect on customer satisfaction was slightly larger. As a result of these results, it was possible to establish that the service landscape of Barber Shop affects customer satisfaction and re-visit intention.

I. 서 론

대다수의 남성들은 미용실에서 단순히 머리를 자르거나 모양을 다듬기만 했었다. 최근 들어 자신을 더 적극적으로 표현하고 가꾸는 남성들의 증가로 인해 바버샵 서비스스케이프에 대한 수요가 급증하고 있다. 이용업은 현재 전국에 14,116개의 업소가 있고 그 중 서울지역에 2,135개의 이용업소가 있다(Kosis, 2021). 남성전문 시장의 수요와 공급이 증가함에 따라 경쟁력이 상승되고 있음으로 이용서비스 업체들은 남성소비자들을 중심으로 만족도를 높일 수 있는 서비스를 개발할 필요가 있다(Son, 2017). 그에 따라 더 다양한 바버샵 서비스스케이프가 생겨났다. 뷰티산업은 대표적인 서비스 산업이다. 서비스 제공자는 고객이 원하는 것들을 정확히 파악하고 만족할 수 있도록 서비스 품질을 제공해야 한다. 뷰티서비스산업은 과거에 비해 고객위주의 시장으로 변화되면서 고객들은 다양한 서비스품질을 요구하고 있다(Park, 2019). 뷰티산업의 주요목적은 수익을 계속 창출해 내는 것이다. 그러기 위해서는 고객들에게 최고의 서비스스케이프로 고객만족도를 높이는 맞춤 서비스를 제공함으로서 품질관리가 지속적으로 이루어져야한다. 또한 남성 소비자의 영향력 확대와 남성 전용공간의 필요성 등 남성 소비자의 다양한 욕구를 분석해야한다(Yang, 2019).

본 연구는 바버샵 서비스 이용 시 서비스스케이프에 대한 고객인식이 고객만족 및 재방문의도에 미치는 영향을 실증하기 위한 것이다. 서비스스케이프에 대해 고객이 인지하는 유용성 및 이용 편리함의 정도는 서비스에 대한 공동창조 활동과 공유가치의 창출과정을 거친 후 궁극적으로 고객만족 및 재방문의도에 영향을 미친다. 뷰티산업의 유형적 서비스에서 중요한 역할을 하는 것이 서비스스케이프이다. 이는 고객만족과 재방문 의도에도 영향을 미치고 있기 때문에 점차 서비스스케이프의 품질은 높아질 수밖에 없다. 이런 구조적 영향관계를 실증하기 위해 서울지역을 4개 권역으로 나누어서 표본을 임의할당한 후 바버샵 이용 고객을 대상으로 설문을 통해 분석한 결과 바버샵 서비스스케이프에 대한 고객만족이 재방문의도에 영향을 미치게 된다는 것을 알 수 있었다. 이에 본 연구는 서비스스케이프에 관한 연구범위의 확대를 위해 바버샵의 서비스스케이프를 다차원적으로 접근해보고 바버샵의 서비스스케이프가 고객만족에 미치는 영향과 재방문의도를 알아보고자 한다.

II. 이론적 배경

1. 바버샵(Barber shop)

바버샵은 이용실과 미용실의 장점을 합쳐놓은 복합공간이다. 고급스럽고 클래식한 감성에 이용실의 업무와 미용실의 업무를 포함하고 있다. 바버샵은 이용실과 미용실의 장점을 합친 서비스를 받을 수 있고 패션관련 쇼핑 및 취미를 한 번에 즐길 수 있는 공간이다. 또 기존의 미용실에선 하지 못했던 면도와 안면마사지를 할 수 있어서 남성고객의 지지를 받는 뷰티공간이다. 바버샵은 빠른 발전과 변화가 이루어지는 미용시장에서 맨즈그루밍(men's grooming)의 흐름을 타고 큰 관심을 받고 있다. 현재 이용 산업은 빠르게 변화하고 있는데 그 중에서도 남성전용 미용시장이 성행하고 있다. 현대의 남성들은 이용을 위해서만이 아니라 여러 가지 복합 서비스를 받기 위해 바버샵에 방문한다. 헤어관련 서비스나 면도, 안면 마사지에만 이르지 않고 맞춤형 휴식을 위해서 방문한다. 바버샵은 이용실의 부족함을 완벽히 채워주고 있다. 기본커트는 물론이고 포마드를 발라서 연출하는 클래식 스타일은 고객들을 만족시킨다. 또한 깔끔하고 쾌적한 환경에서 편안한 서비스를 받을 수 있는 장점이 있기에 고객들의 재방문 또한 높다. 뉴욕에서는 헤어, 면도, 쉐이빙 등 다양한 서비스와 매니큐어 서비스를 받을 수 있고 편안한 대기공간에서 시청각 서비스 및 간단한 음료서비스 등의 감성적 배려까지 이어지는 바버샵이 성행하고 있다. 쉐이빙 서비스는 많은 남성들이 선호한다(Kim, 2016). 또한 바버샵은 한국식 이용실이 아닌 유럽식의 모습을 재현하면서 젊은 층에서 소리 없이 번져 나가다가 2010년을 넘어오면서 디지털시대에 염증과 실증이 난 현대 남성들에게 클래식하고 아날로그 감성을 전해주고 있다. 그 덕분에 바버샵은 봄비와도 같은 장소가 되었다(Son, 2017).

2. 서비스 스케이프(Service scape)

서비스 스케이프(servicescape)는 물리적 서비스 환경이 기업과 소비자 사이에 생겨나는 것을 의미한다. 서비스의 수행 또는 소비를 용이하게 하는 시설인 서비스스케이프(service scape)는 경치, 풍경, 전망 등을 의미하는 랜드스케이프(Landscape)와 바다의 경치와 전망을 의미하는 시스케이프(Seascape) 등과 같이 서비스(service)뒤에 스케이프(scape)접미사를 붙여 합성한 용어이다(Lee & An, 2016). 사회적 영향을 배제시킨 순수한 물리적 환경요소를 말하며 Bitner(1992)에 의하여 처음으로 사용된 명칭이다. Bitner는 물리적 환경에서의 품질 구성요소를 공조환경, 공간배치·기능성, 신호·상징물·인공물 등의 3가지 차원으로 분류했다. 서비스스케이프는 단순히 서비스 업체의 내부 및 외부디자인 시설만 의미하는 것이 아니다. 향기, 온도, 소음, 명암 등 부가적 요소들까지 포함한 물리적 환경을 의미한다. Lee(2011)는 매장의 공간사용, 가구배치, 조명, 온도, 음향 등과 같이 고객에게 영향을 줄 수 있는 물리적 환경이 매장이미지를 형성하는데 중요하다고 했다. Lee(1999)에 따르면 고객행동, 품질지각 및 서비스만족에 영향을 미친다는 것을 알 수 있었다. 또 Nam(2007)은 소비자 주변 환경의 구체적, 공간적, 물리적 측면이 시각, 촉각, 청각, 후각 등을 통해 고객지각에 영향을 미친다고 했다. Um(2010)는 서비스스케이프의 개념이 물리적 환경, 환경적 단서, 분위기 등으로 혼용되고 있다고 했다. Na (2013)에 따르면 고객의 구매결정에 도움을 주는 요소로서 고객의 태도와 이미지 형성에 영향을 미친다고 했다. Kim(2020)은 뷰티샵의 서비스스케이프가 집이나 회사 주변 등 가까운 곳을 이용함으로서 현실을 벗어나 스트레스를 해소할 수 있는 회복적 환경이 조성된다고 했다.

3. 고객만족

Babin & Griffin(1998)은 관계마케팅이 마케팅성과를 나타내는 중요한 측정도구로서 강조된다고 했다. 고객만족은 마케팅 철학, 이론, 실무의 관점에서 고객개념화하고 측정된다. Min(1995)은 호텔기업간의 경쟁적 벤치마킹 결과 호텔이 추구해야 할 고객만족 방향에 대해 연구했다. Jo(1999)는 고객만족이 지각된 서비스품질에 미치는 영향과 구매경험과 관여도를 통해 고객만족과 불만족이 소비자의 어떤 행동을 발생케 하는지 규명했다. Lee(1999)는 고객만족에 대해 소비경험으로부터 발생하는 고객의 심리적 결과물로서 파악하는 견해와 지각적 평가 과정으로 파악하는 견해를 대별할 수 있다고 했다. Kwon(2000)는 호텔서비스품질과 고객만족도를 결합하여 두 변수 간의 관계를 규명하고 서비스품질에 따른 고객만족도 차이여부를 규명했다. 기업은 사회에 공헌하는 경제활동을 해야 하는 책임을 지고 있기 때문에 사회공헌활동과 환경보호활동과 같은 기업 이미지가 고객만족의 중요한 요소로 제기되고 있다(Choi, 2004). Seok(2010)는 고객만족이 제품의 구매, 재구매의도, 구전, 불평 등, 고객의 구매 후 행동에 영향을 주며 기업의 수익성에 직간접적으로 영향을 미친다고 했다. 고객만족은 마케팅과 비즈니스의 영역에서 중요하게 여기는 핵심개념중 하나이다. 고객만족은 고객의 구매의도와 고객유지에 잠재적인 영향력을 가지고 있기 때문에 수많은 연구들이 현재까지 진행되어 오고 있으며 경제학에서는 전체 마케팅시스템의 효율성을 평가하는 개념으로서 사회학에서는 한 사회의 복지 수준을 측정하는 개념으로 한다(Kim, 2010). 고객만족이란 상품 또는 서비스의 질적 수준보다 고객의 기대수준에 따라 결정되며, 단일 상품이나 특정 경험에 한정되어 평가가 이루어지는 것이 아니라 총체적이고 포괄적인 평가라고 설명하였다(Yoo, 2017). 또한 서비스 과정에서 고객들이 겪는 행복과 즐거움이 고객만족이라 할 수 있다(Moon & Yang, 2021). 고객만족이란 서비스에 대해 고객이 느끼는 감정과 연관성이 있다(Kim & Jin, 2021).

4. 재방문의도

재방문 의도는 고객이 미래에도 서비스를 반복하여 이용할 가능성이라고 정의할 수 있다(Seok, 2010).

Fornall(1992)은 재 구매행동을 실질적인 재 구매행동과 관계지속행위와 직접적으로 연관시켜 실제 행위의 대용으로 사용할 수 있으며, 향후의 구매와 직접적인 관련을 맺고 있다는 측면에서 재 구매행동은 마케팅에 있어 가장 핵심적인 개념이라 주장하고 있다. Tayler & Baker(1994)는 구매 의도는 이용자와 기업 사이에 한 번의 구매의도로 끝나는 것이 아니라 서비스 만족에 따라서 지속적으로 나타난다고 했다.

Zeithaml & Parasuraman(1998)은 이와 관련하여 고객이 미래에 현재 거래관계를 맺고 있는 기업과 지속적으로 거래관계를 유지하고 있는지 아닌지 아니면 거래관계를 중단하려고 하는지와 관련된 미래행동의 중요성을 강조하였다. 특정 제품에 대한 재구매의도나 점포에 대한 재방문의도는 향후에 소비자의 구매와 직접적인 관련을 맺고 있기 때문에 점포주의 입장에서는 소비자의 만족도를 높임으로서 재방문의도를 높이고 자 노력하고 있는 것이다(Seok, 2010). 고객만족은 재방문의도를 증가시켜 기업성과에 중대한 영향을 미친다고 했다(Kim, 2016). 또한 재방문의도는 상품의 재구매 의도와 비슷한 개념이라고 할 수 있으며 자신의 신념과 태도가 행동으로 영향을 미치며 미래의 행동에 대한 의지라고 정의한다. 따라서 고객이 서비스를 다시 이용하게 되는 재구매의사 라고 한다(Jeong, 2013). 재방문의도는 고객이 가지고 있는 신념과 태도가 행동으로 옮겨지는 정도를 의미하며, 고객이 현재 이용하고 있는 제품이나 서비스를 미래에 다시 이용하고 투자하는 구매의사라고 한다(Yoo, 2017).

III. 내용 및 방법

1. 연구문제

본 연구는 바버샵의 서비스스케이프가 고객만족 및 재방문의도에 미치는 영향에 대해 알아보는 것에 목적이 있다.

첫째, 조사대상자의 인구통계학적 특성을 알아본다.

둘째, 바버샵 이용자의 이용실태를 알아본다.

셋째, 바버샵 이용자 서비스스케이프의 유형성, 응답성, 신뢰성 차원을 알아본다.

넷째, 서비스스케이프가 고객만족과 재방문의도에 미치는 영향을 알아본다.

2. 자료 수집 및 분석

본 연구는 서울시내 바버삽 이용자들을 대상으로 자기기입식 설문지법을 이용해 진행되었다.

2021년 1월 3일부터 2월 25일까지 총 210부의 설문지를 배포하여 210부를 회수, 그 중 응답내용이 불성실하거나 신뢰성이 없다고 판단되는 10부의 설문지를 제외한 200부를 최종분석 자료로 사용했다.

수집한 자료의 분석은 SPSS 25.0을 이용했다.

첫째, 조사대상자의 인구통계학적 특성을 알아보기 위해 빈도분석을 실시하였다.

둘째, 측정도구의 타당도 분석을 위해 탐색적 요인분석을 실시하였고, 신뢰도를 측정하기 위해 Cronbach's α계수를 산출했다.

셋째, 조사대상자의 일반적 특성에 따라 차이가 있는지를 알아보기 위해 독립표본 t-test 및 One-way ANOVA(일원변량분석)를 실시하였으며 사후검정 방법으로 Scheffe-test를 실시하였다.

넷째, 바버샵 서비스스케이프 4개 영역과 인구통계적 변인과의 F검증을 통해 관련성을 측정하였다.

다섯째, 서비스스케이프가 고객만족, 재방문의도에 미치는 영향을 알아보기 위해 상관관계 분석(Correlation analysis)을 실시하여 비교분석하였다.

3. 측정도구 구성

조사대상자의 일반적 특성은 명목척도로 구성하였으며 이용 실태에 관한 문항은 Kim(2002), Choi(2003)의 문항을 참고하여 6문항으로 구성하였다. 유형성과 응답성, 신뢰성에 관한 문항은 Jeong(2015), Yoo(2017)의 연구를 참고하여 각각 13문항, 10문항, 12문항으로 구성하였고, Seok(2010), Son(2017)의 선행연구를 바탕으로 고객만족 13문항, 재방문의도 10문항을 수정 후 보완하여 5점 리커트 척도로 사용하였다.

IV. 결과 및 고찰

1. 조사대상자의 일반적 특성

조사대상자의 일반적 특성을 알아보기 위해 빈도분석을 실시한 결과는 (Table 1)과 같다.

General characteristics of the subject (N=200, %)

분석결과 연령은 20대 6명(3%), 30대 70명(35%), 40대 68명(34%), 50대 36명(18%), 60대 14명(7%), 70대 6명(3%)으로 나타났다. 학력은 중졸이하가 14명(7.%), 고졸이하가 22명(11%), 전문대 재학/졸업자가 52명(26%), 대학교 재학/졸업자가 106명(53%), 대학원 재학/졸업자가 6명(3%)을 차지했다. 직업은 회사원 104명(52%)과 자영업자 54명(27%)으로 나타났고, 월 평균 소득은 400만원 미만이 전체의 87%이었다. 결혼 여부는 미혼 60명(30%), 기혼 108명(54%), 기타 32명(16%)으로 나타났다.

2. 변수의 타당성과 신뢰도 검증

1) 바버샵 서비스스케이프 신뢰도

바버샵 서비스스케이프에 대해 고객들이 평가한 4개 영역 32개 문항으로 신뢰도(내적 일관성)를 측정하였다. 검증결과 전체 신뢰도(Cronbach's Alpha) 계수는 .977, 재방문의도는 256.3으로 유의미하게 나타났다.

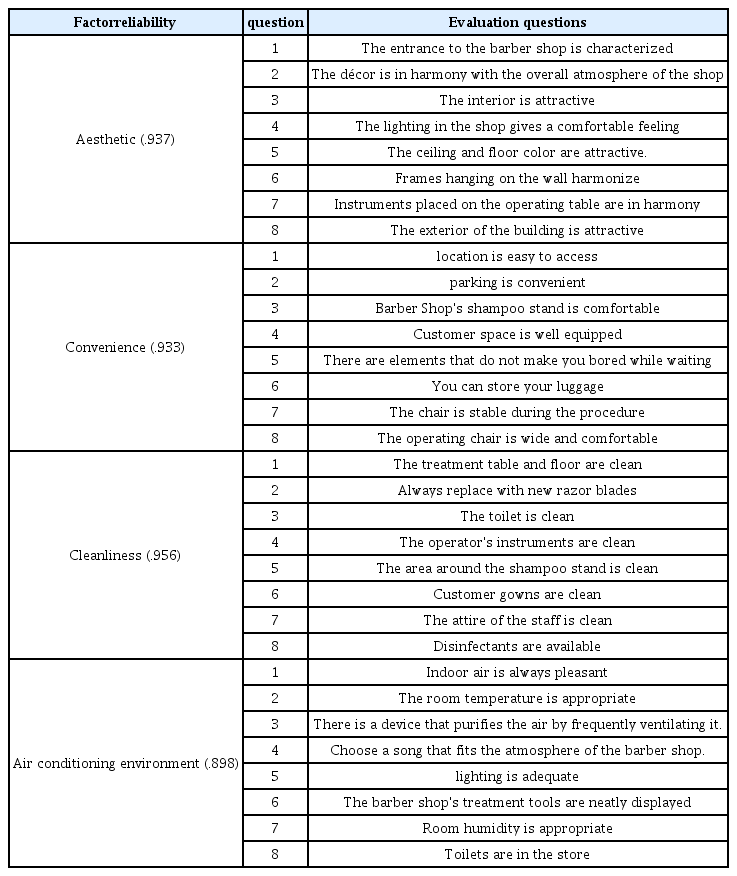
또한 각 요인별 신뢰도(Cronbach's Alpha) 계수는 공조환경이 .898, 청결성이 .956, 편의성이 .933, 심미성이 .937의 결과를 보여 측정 설문이 고객들의 서비스스케이프를 평가하는 데 신뢰성이 있는 것으로 나타났다.

3. 기술통계적 분석

1) 바버샵 이용 빈도

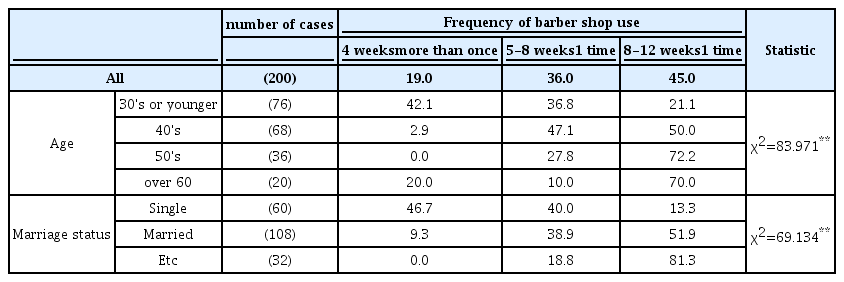
바버샵 고객들의 이용빈도는 5 ~8주 1회(36%), 8~12주 1회(45%), 4주에 1회 이상 이용자는 19%로 나타났다. 연령별로 30대 이하는 4주에 1회 이상(42.1%) 이용 빈도가 타 연령층과 비교해 높았다. 40대는 4주에 1회 이상의 빈도가 2.9%, 5 ~8주에 1회가 47.1%, 8주~12주에 1회 방문이 50.0%로 나타났다.

미혼자의 경우 4주 1회 이상 이용이 46.7%, 5~8주 1회(40.0%), 8~12주 1회(13.3%)로 나타났고, 기혼자는 4주 1회 이상 이용이(9.3%), 5~8주 1회(38.9%), 8~12주 1회(51.9%)로 나타났으며 기타의 경우는 5 ~8주 1회(18.8%), 8~12주 1회(81.3%)로 나타났다.

2) 바버샵에서 주로 받는 서비스

바버샵에서 가장 많이 이용하는 서비스는 헤어 컷(32.0%), 포마드 스타일링(32.0%), 헤어염색(22%), 헤어 펌(13.%), 안면마사지(1.0%)로 나타났다. 연령별로는 30대 이하에서 포마드스타일링(50.0%), 헤어컷(23.7), 헤어펌(18.4%), 헤어염색(5.3%), 안면마사지(2.6%)로 나타났다. 40대에서는 헤어컷(44.1%)로 가장 높게 나타났고, 50대에서는 헤어염색(44.4%)로 나타났으며 60대에서는 헤어컷(50.0%), 헤어염색(40.0%)로 나타났다. 미혼(56.7%), 4주 1회 이상 이용자(57.9%) 층에서 상대적으로 높게 나타났다. 미혼 층에서는 포마드스타일링(56.7%), 헤어컷(20.2%), 헤어펌(16.7%), 헤어염색이(3.3%)으로 나타났으며 기 층에서는 헤어컷(37.0%)의 비율이 가장 높았고, 기타 층에서도 헤어컷(37.5%)의 비중이 높았다. 이용 빈도는 4주에 1회 이상 포마드스타일링(57.9%)하는 비율이 가장 높았으며, 5~8주 1회 방문에서는 헤어컷(33.3%)과 포마드스타일링(33.3%)이 동일하게 나왔다. 또 8~12주 1회에서는 헤어컷(35.6%)로 가장 높게 나타났다.

3) 주로 이용하는 바버샵 형태

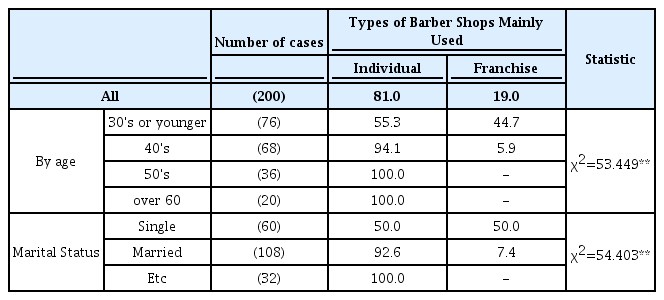
주로 이용하는 바버 샵 형태는 개인 샵(81%)로 프랜차이즈(19.0%)보다 높게 나타났다. 30대 이하에서 개인샵(55.3%), 프랜차이즈(44.7%)로 나타났으며 40대에서는 개인샵(94.1%), 프랜차이즈(5.9%)로 50대와 60대 이상에서는 개인샵이(100.%)로 나타났다. 미혼 층에서는 개인(50,0%), 프랜차이즈(50.0%)로 동일하게 나타났고 기혼 층에서는 개인샵(92.6%), 프랜차이즈(7.4%)로 나타났으며 기타 층에서는 개인샵이(100.0%)로 나타났다.

4. 바버샵 서비스스케이프 평가

1) 수준 평가

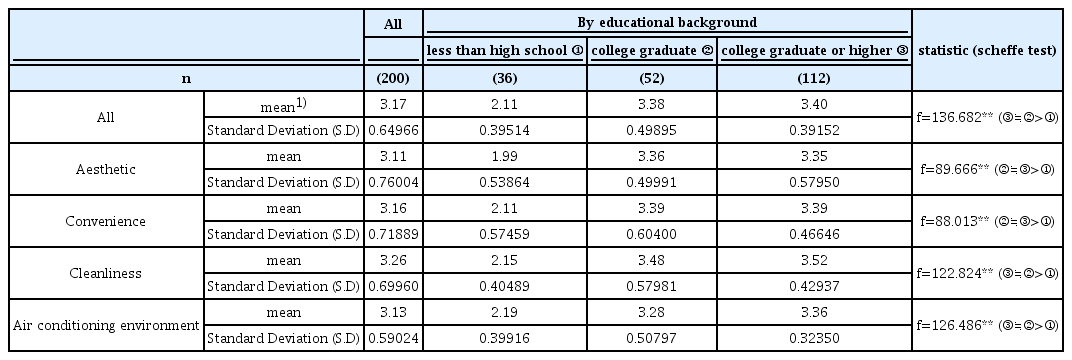
바버샵 서비스스케이프에 대한 평가결과, 5점 만점에 3.17점 수준으로 평가되었다. 4개 영역별로 심미성은 5점 만점에 3.11점, 편의성은 3.16점, 청결성은 3.27점, 공조환경은 3.13점으로 청결성 평가가 가장 높은 것으로 나타났다. (※scheffe test : 청결성>편의성≒공조환경≒심미성, p>0.00) 바버샵 서비스스케이프 평가점수는 54.2점이다. 4개 영역별로 심미성은 100점 만점에 5 2.8점, 편의성은 5 4.1점, 청결성은 5 6.7점, 공조환경은 53.3점으로 청결성 점수가 가장 높았다.

2) 특성별 평가

연령별로 바버샵 서비스스케이프 수준에 대한 평가결과, 40대와 30대가 모든 영역에서 타 연령층보다 유의미하게 수준을 높게 평가하였다(※scheffe test : 40대≒30대 이하 > 50대 > 60대이상, p>0.00).

학력별로 바버샵 서비스스케이프 수준에 대한 평가결과 대졸이상 및 전문대 졸업 층이 모든 영역에서 고졸 이하 층 보다 유의미하게 높게 평가하였다(※scheffe test : 대졸이상40대≒전문대졸 > 고졸이하, p>0.00).

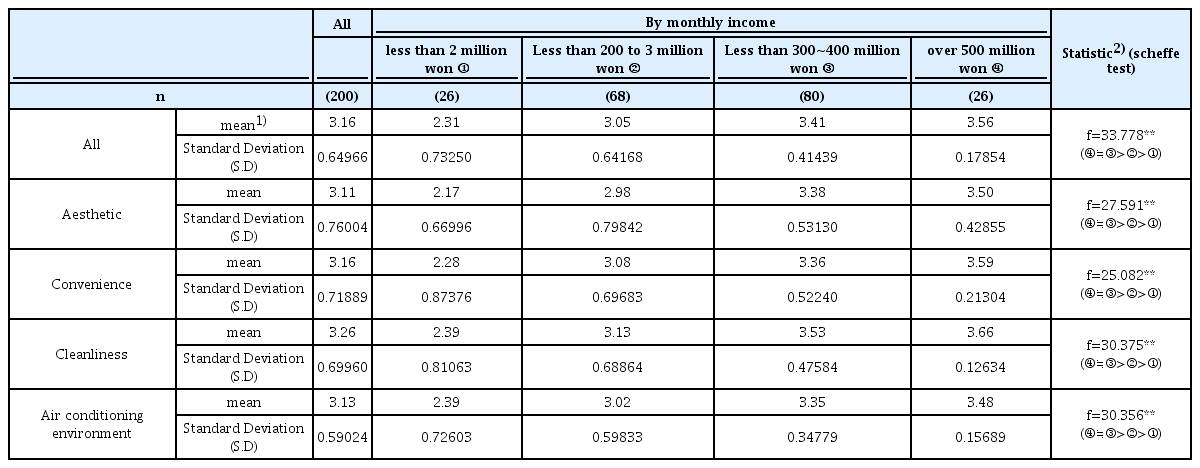
소득별 바버샵 서비스스케이프 수준에 대한 평가결과 300~400만원, 500만원 이상 층이 모든 영역에서 고졸 이하 층 보다 유의미하게 높게 평가하였다.

결혼여부별 바버샵 서비스스케이프 수준에 대한 평가결과 미혼과 기혼 층이 기타 층보다 유의미하게 높게 평가하였다.

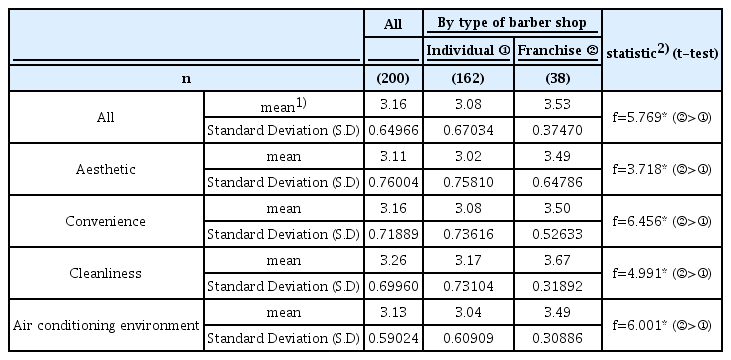
바버샵 형태별 서비스스케이프 수준에 대한 평가결과 프랜차이즈보다 개인샵을 유의미하게 평가하였다.

5. 바버샵 만족도 및 재방문의도 평가

1)서비스스케이프가 고객만족 및 재방문의도에 미치는 영향

바버샵 서비스스케이프 평가와 고객만족과의 관련성은 R=.781, 재방문의도와의 관련성은 R=.618으로 유의미한 상관성이 있는 것으로 나타났다.

2) 특성별 평가

연령별로 바버샵 고객만족 및 재방문의도에 대한 평가결과, 40대와 30대가 모든 영역에서 타 연령층보다 유의미하게 수준을 높게 평가하였다.

학력별로 바버샵 고객만족 및 재방문의도에 대한 평가결과, 대졸이상 및 전문대 졸업 층이 모든 영역에서 고졸이하 층 보다 유의미하게 높게 평가하였다.

소득별 바버샵 고객만족 및 재방문의도에 대한 평가결과, 500만원 이상 층이 300~400만원 이하 층 보다 유의미하게 높게 평가하였다.

결혼여부별 바버샵 고객만족 및 재방문의도에 대한 평가결과, 미혼이 기혼이나 기타 층 보다 유의미하게 높게 평가하였다.

바버샵 형태별 고객만족 및 재방문의도 대한 평가결과, 개인샵이 프랜차이즈 샵보다 유의미하게 높게 평가하였다.

3. 바버샵 서비스스케이프가 만족도 및 재방문의도 미치는 영향력

바버샵 4개 영역이 서비스스케이프 전체 평가에 미치는 영향력을 살펴보면, 편의성(R=.957)과 청결성(R=.963)의 영향력이 조금 더 큰 것으로 분석되었다. 서비스스케이프 평가가 고객만족과 재방문의도에 미치는 영향력은 고객만족에의 영향력이 R=.781, 재방문의도에 미치는 영향력은 R=.618로 고객만족에 미치는 영향력이 좀 더 큰 것으로 나타났다.

V. 결 론

본 연구는 바버샵 서비스스케이프가 고객만족 및 재방문의도에 미치는 영향을 규명하고자 하였다. 바버샵 서비스스케이프 요인을 심미성, 편의성, 청결성, 공조환경으로 설정한 후 바버샵의 서비스스케이프 평가와 고객만족 및 재방문의도와의 관련성을 검증하였다.

연구결과는 다음과 같다.

첫째, 이용자들의 연령은 30대, 40대가 전체의 69%를 차지했으며 대졸자가 절반을 차지했고 직업은 회사원이 가장 많았다. 또 300~400만원 미만의 수입의 기혼자가 주를 차지했다.

둘째, 바버샵 서비스스케이프에 대한 고객들의 이용실태는 8주~12주에 1회 방문이 가장 높았고, 30대 이하가 4주에 1회 방문으로 이용하는 빈도가 높았다. 미혼자의 경우 4주에 1회 이상 방문하는 횟수가 기혼자 보다 상대적으로 높았고 바버샵을 이용하는 이유는 스타일 유지를 위해서가 많았다.

바버샵에서 가장 많이 받는 서비스는 헤어컷과 포마드 스타일링으로 나타났다. 그 중 포마드 스타일링은 30대 이하이며 미혼이고 4주에 1회 이상 방문하는 이용자층에서 상대적으로 높게 나타났다. 바버샵 선택시 가장 중요하게 생각하는 요소로는 고객의 절반이 테크닉을 꼽았다. 특성별로 바버샵 이용 빈도가 1주에 1회 이상인 고객은 가격과 서비스를 중요하게 생각했고 8~12주에 1회 이용고객은 테크닉을 중요하게 생각했다. 또한 주로 이용하는 바버샵은 개인샵이 많았다. 프랜차이즈 이용은 30대 이하 연령층이 가장 높게 나타났고, 50대에서 60대의 고객들은 100% 개인샵을 선호하는 것으로 나타났다. 미혼층의 프랜차이즈 방문이 기혼이나 기타 층보다 상대적으로 높게 나타났다. 바버샵 이용기간은 50%의 이용자가 5년 이상 이용한 것으로 나타났다. 바버샵 이용 형태는 개인샵을 이용하는 고객의 경우 이용기간이 5년 이상인 경우가 높았고 프랜차이즈 이용 고객은 3년 미만이 가장 높게 나타났다.

셋째, 바버샵 이용자의 유형성, 응답성, 신뢰성 차원을 알아본 결과 연령별로 바버샵 서비스스케이프의 수준평가는 30대 이하 40대가 모든 영역(심미성, 편의성, 청결성, 공조환경)에서 타 영역보다 유의미하게 수준을 높게 평가했다. 학력별로는 전문대 졸업에서 대졸 이상 층이 모든 영역에서 고졸 이하 층보다 유의미하게 평가했음을 알 수 있었고 소득별로는 500만 원 이상 소득층에서 높게 나타났다. 미혼 층이 다른 층보다 유의미하게 평가했으며 바버샵 형태별로는 프랜차이즈를 개인샵보다 유의미하게 평가했다.

넷째, 서비스스케이프가 고객만족과 재방문의도에 미치는 영향을 알아본 결과 바버샵 서비스스케이프 평가와 고객만족과의 관련성은 (.781)로 재방문의도와의 관련성은 (.618)으로 유의미한 상관성이 나타났다.

연령별로 바버샵 서비스스케이프 평가결과 30대와 40대가 모든 영역에서 타 연령층보다 유의미하게 평가함을 알 수 있었다. 학력별로는 전문대 졸업 층, 수입이 500만 원 이상인 층에서 가장 유의미한 결과가 나타났다. 결혼여부별로는 미혼 층에서 유의미하게 평가함을 알 수 있었고, 바버샵 형태별로는 프랜차이즈가 개인샵보다 유의미함을 알 수 있었다. 바버샵 서비스스케이프가 고객만족과 재방문의도에 미치는 영향을 보면 고객만족에 대한 영향은 R=.781, 재방문의도에 미치는 영향은 R=.618로 고객만족에 미치는 영향이 조금 더 큰 것으로 나타났다. 이와 같은 결과로 바버샵의 서비스스케이프는 고객만족 및 재방문의도에 영향을 미친다는 것을 규명할 수 있었다. 본 연구는 다음과 같은 한계점을 가지고 있으며 이를 고려한 후속연구가 필요하다. 연구대상 지역을 서울 4개 권역으로 한정하였기 때문에 표본의 대표성을 확보하는데 한계가 있었고 프랜차이즈 바버샵과 개인 바버샵을 대상으로 비교 연구한 선행연구의 부족으로 다양한 측면에서의 연구에 한계가 있었다. 향후 연구에서는 보다 세부적인 영역에서의 비교 연구가 시행될 것으로 기대한다.

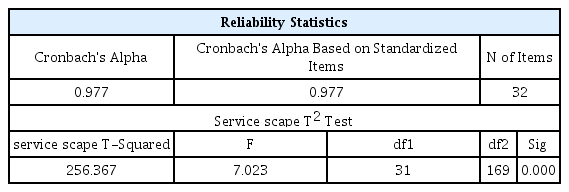
Barbershop Servicescape Evaluation Overall Reliability Verification

Reliability verification by area of Barbershop servicescape

Frequency of barber shop use

Services mostly received at the barber shop (unit:%)

Types of Barber Shops Mainly Used (unit:%)

Barber Shop Servicescape Level Evaluation by Educational Level (unit :%)

Barber Shop Servicescape Level Evaluation by Educational Level (unit:%)

Barber Shop Servicescape Level Evaluation by Income (unit:%)

Barber Shop Servicescape Level Evaluation by Marriage Status (unit:%)

Servicescape level evaluation by barber shop type (unit:%)

Correlation Analysis of Barber Shop Servicescape, Customer Satisfaction, and Revisit Intention

Barber Shop customer satisfaction and revisit intention by age (unit:%)

Barber Shop Customer Satisfaction and Revisit Intention by Educational Background (unit:%)

Barber Shop Customer Satisfaction and Revisit Intention by Income (unit:%)

Barber Shop customer satisfaction and revisit intention by marital status (unit:%)

Customer Satisfaction and Revisit Intention by Barber Shop Type (unit:%)

References

1. Bitner M. J.. 1992;Servicescapes The impact of physical surroundings on customers and employees. Journal of Marketing 56(2):57–71.
2. Babin & Griffin (1998). Encounter satisfaction versus overallsatisfaction versus service quality: the consumer’s voice. SagePublications, Thousand Oaks, CA.
3. Bitner, Mary J., & R. Hubbert. (1994). Encounter Satisfaction Versus Overall Satisfaction versus Quality. Rust, R. & Oliver, des., Thousand, oaks, CA : Sage Publication, p.72.
4. Choi, C. K. (2003). Effect of servicescape quality on restaurant preference, Department of Business Administration. Doctoral dissertation. Daegu University.
5. Choi, C. S. (2003). A Study on Empowerment and Job Performance of Travel Agents. Kyonggi University Graduate School. Doctoral dissertation.
6. Choi, C. H. (2004). A study on the effect of large discount store consumers' store selection criteria on customer satisfaction and store preference, Doctoral dissertation. Cheongju University.
7. Fornell C.. 1992;A National Customer Satisfaction Barometer: The Swedish Experience. Journal of Marketing 56(1):10–13.
9. Jo N. J.. 1999;A Study on Customer Satisfaction and Perceived Service Quality in Tourist Hotel. Journal of Tourism Management 6(1):59–83.
10. Kwon, S. H. (2000). A study on the effect of hotel service quality on customer satisfaction. Master's thesis. Kyonggi University Graduate School of Business.
11. Jeong, B. G. (2015). The Effect of Hotel Service Quality on Customer Satisfaction, Revisit Intention and Recommendation Intention: A Study on Chinese Tourists. Master's thesis. Dongguk University.
12. Jeong, B. G. (2013). Effect of Service scape of Luxury Hotel Banquet Hall on Customer Satisfaction and Revisit Intention. Honam University Graduate School of Hotel & Tourism. Doctoral dissertation.
13. Kim K., Kim H., Jang K.. 2002;The Effect of Servicescape of Hotel Restaurant on Customer Satisfaction. Journal of the Korean Tourism Management Studies 6(3):3–5.
14. Kim, J. H. (2010). Internet shopping Mall Servicescape : Its Impact on Customers' Internal Responses and Revisit Intention. Keimyung University Graduate School: Business Administration.
15. Kim, J. Y. (2016). The effect of consumers' perception of benefits according to the visual framing of package design on purchase intention and intention to pay price. Master's thesis. Hankuk University of Foreign Studies Graduate School of Business.
16. Kim, S. H. (2020). The effect of restorative servicescape of beauty shop on customer satisfaction. Kyonggi University Graduate School of Arts: K-Beauty.
17. Kim , Jin . 2021;Effect of Beauty Salon Service Quality on Willingness to Pay and Customer Satisfaction. Journal of the Korean Society of Cosmetology 27(1):182–189.
18. Lee E. C., An S. H.. 2016;Effect on Customer Emotional Response and Behavioral Intention by Group Meal Service scape. Journal of Food Service Management 19(5):61–78.
19. Lee Y. J.. 2011;Comparison of excellence of service quality measurement model: Focusing on SERVQUAL model, Grönroos model, and 3D quality model. Journal of Service Marketing Society 4(2):91–126.
20. Lee K. J.. 1999;A survey on the perceptions of nursing providers about the use of restraints in elderly facilities. Journal of Geriatric Nursing 3(2):158–168.
21. Moon , Yang . 2021;Effect of Online Reservation System Quality for Beauty Salon on Custom er Satisfaction and Continued Use Intention. Korean Society of Cosmetology 27(3):770–789.
22. Na, Y. H. (2013). Effect of Coffee Shop's Service scape on Customer Loyalty: Focusing on Mediating Effect of Service Value, Customer Satisfaction, and Brand Image. Department of Business Administration, Konyang University Graduate School. Doctoral dissertation.
23. Min H. S.. 1995;A study on the service level of a family restaurant using AHP. Journal of the Korean Society of Food Service Industry 1(1):41–70.
24. Nam, Y. J. (2007). Analysis of the effect of leisure activity type on leisure satisfaction. Master's thesis. Dong-A University Graduate School of Business.
25. Park, E. H. (2019). Effect of Servicescape on Organizational Effectiveness, Customer Behavioral Intention Recognition, and Customer Orientation of Beauty Workers. Seokyeong University Graduate School of Beauty Arts.
26. Seok Y. N.. 2010;The Effect of Beauty Salon Service Quality on Customer Satisfaction. Journal of the Korean Society of Cosmetology 16(2):396–402.
27. Son, J. H. (2017). A study on dissatisfaction with hair salon use and intention to use barber shop among men in their 20s and 30s in Daegu area. Kyungil University Graduate School.
28. Seok, Y. N. (2010). The Effect of Beauty Salon Service Quality on Customer Satisfaction and Revisit Intention. Master's thesis. Seokyeong University Graduate School.
29. Taylor S. A., Baker T. L.. 1994;An assessment of the relationshipbetween service quality and customer satisfaction in the formation of consumers' purchase intentions. Journal of Retailing 70(2):163–178.
30. Um Y. H.. 2010;Effect of Coffee Shop's Service scape on Customer Satisfaction and Relationship Performance. Journal of the Korean Tourism Research Society 24(3):329–344.
31. Zeithaml Valarie A., Berry Leonard L., Parasuraman A.. 1998;Communication and Control Processes in the Delivery of Service Quality. Journal of Marketing 52(4):35–48.
32. Yoo, T. H. (2017). The quality of banquet service at the first-class hotel in Seoul is critical to customer satisfaction and revisit intention. Research on the impact. Master's thesis. Kyunghee University Graduate School of Tourism.
33. Yang, T. M. (2019). A study on the perception of risk perception of male consumers using beauty salons. Seokyeong University General Graduate School Department of Beauty Arts.
34. Zeithaml, Berry, Parasuraman (1998), Five Imperatives For Buttle, Francis, “SERVQUAL: review, critique, research agenda”, European Journal of Marketing, 30(1), pp.8-32.
35. Zeithaml V. A.. 1988;Consumer perceptions of price, quality, and value:a means-end model and synthesis of evidence. The Journal of Marketing 52(3):2–22.

Article information Continued

Table 1.

General characteristics of the subject (N=200, %)

Persons %
All 200 100.0
Gender male 200 100.0
Age 20's 6 3.0
30's 70 35.0
40's 68 34.0
50's 36 18.0
60's 14 7.0
70's 6 3.0
Final Education less than middle school 14 7.0
less than high school 22 11.0
College enrollment/graduation 52 26.0
University enrollment/graduation 106 53.0
Graduate school/graduation 6 3.0
Job Students (University/Graduate students) 2 1.0
employee 104 52.0
self-employment 54 27.0
Official 28 14.0
profession 12 6.0
Average Income (Monthly) less than 1 million won 18 9.0
100 million won to less than 200 million won 8 4.0
200 million won to less than 3 million won 68 34.0
3 million won to less than 4 million won 80 40.0
over 500 million won 26 13.0
Marriage status single 60 30.0
married 108 54.0
Etc 32 16.0

Table 2.

Barbershop Servicescape Evaluation Overall Reliability Verification

Reliability Statistics
Cronbach's Alpha Cronbach's Alpha Based on Standardized Items N of Items
0.977 0.977 32
Service scape T2 Test
service scape T-Squared F df1 df2 Sig
256.367 7.023 31 169 0.000

Table 3.

Reliability verification by area of Barbershop servicescape

Factorreliability question Evaluation questions
Aesthetic (.937) 1 The entrance to the barber shop is characterized
2 The décor is in harmony with the overall atmosphere of the shop
3 The interior is attractive
4 The lighting in the shop gives a comfortable feeling
5 The ceiling and floor color are attractive.
6 Frames hanging on the wall harmonize
7 Instruments placed on the operating table are in harmony
8 The exterior of the building is attractive
Convenience (.933) 1 location is easy to access
2 parking is convenient
3 Barber Shop's shampoo stand is comfortable
4 Customer space is well equipped
5 There are elements that do not make you bored while waiting
6 You can store your luggage
7 The chair is stable during the procedure
8 The operating chair is wide and comfortable
Cleanliness (.956) 1 The treatment table and floor are clean
2 Always replace with new razor blades
3 The toilet is clean
4 The operator's instruments are clean
5 The area around the shampoo stand is clean
6 Customer gowns are clean
7 The attire of the staff is clean
8 Disinfectants are available
Air conditioning environment (.898) 1 Indoor air is always pleasant
2 The room temperature is appropriate
3 There is a device that purifies the air by frequently ventilating it.
4 Choose a song that fits the atmosphere of the barber shop.
5 lighting is adequate
6 The barber shop's treatment tools are neatly displayed
7 Room humidity is appropriate
8 Toilets are in the store

Table 4.

Frequency of barber shop use


number of cases Frequency of barber shop use
Statistic

4 weeksmore than once
5-8 weeks1 time
8-12 weeks1 time
All (200) 19.0 36.0 45.0
Age 30's or younger (76) 42.1 36.8 21.1 χ2=83.971**
40's (68) 2.9 47.1 50.0
50's (36) 0.0 27.8 72.2
over 60 (20) 20.0 10.0 70.0
Marriage status Single (60) 46.7 40.0 13.3 χ2=69.134**
Married (108) 9.3 38.9 51.9
Etc (32) 0.0 18.8 81.3
*

difference verification (χ2 test) : *95% significance level,

**

99% significance level, n.s (not significance)

Table 5.

Services mostly received at the barber shop (unit:%)


Number of cases Services mostly received at the barber shop
Statistic

Hair cut
pomade styling
Hair dye
Hair perm
Facial massage
All (200) 32.0 32.0 22.0 13.0 1.0
by age 30's or younger (76) 23.7 50.0 5.3 18.4 2.6 χ2=54.333**
40's (68) 44.1 26.5 23.5 5.9 -
50's (36) 16.7 22.2 44.4 16.7 -
over 60 (20) 50.0 - 40.0 10.0 -
Marital Status Single (60) 20.0 56.7 3.3 16.7 3.3 χ2=40.336**
Married (108) 37.0 20.4 29.6 13.0 -
Etc (32) 37.5 25.0 31.3 6.3 -
frequency of use 4 weeksmore than once (38) 21.1 57.9 10.5 5.3 5.3 χ2=38.139*
5-8 weeks1 time (72) 33.3 33.3 19.4 13.9 -
8-12 weeks1 time (90) 35.6 20.0 28.9 15.6 -

Table 6.

Types of Barber Shops Mainly Used (unit:%)


Number of cases Types of Barber Shops Mainly Used
Statistic

Individual
Franchise
All (200) 81.0 19.0
By age 30's or younger (76) 55.3 44.7 χ2=53.449**
40's (68) 94.1 5.9
50's (36) 100.0 -
over 60 (20) 100.0 -
Marital Status Single (60) 50.0 50.0 χ2=54.403**
Married (108) 92.6 7.4
Etc (32) 100.0 -
*

Difference verification (χ2 test) : *95% significance level,

**

99% significance level, n.s (not significance)

Table 7.

Barber Shop Servicescape Level Evaluation by Educational Level (unit :%)

All
By age
Statistic (scheffe test)
30's or younger
40's
50's
over 60
n (200) (76) (68) (36) (20)
All mean1) 3.17 3.34 3.42 2.85 2.24 f=31.513**
Standard Deviation (S.D) 0.650 0.502 0.310 0.786 0.713 ②≒①>③>④
Aesthetic mean 3.11 3.28 3.39 2.76 2.16 f=22.606**
Standard Deviation (S.D) 0.760 0.621 0.450 0.981 0.695 ②≒①>③>④
Convenience mean 3.16 3.35 3.38 2.92 2.18 f=23.727**
Standard Deviation (S.D) 0.719 0.586 0.403 0.871 0.801 ②≒①>③>④
Cleanliness mean 3.27 3.44 3.53 2.93 2.35 f=26.075**
Standard Deviation (S.D) 0.700 0.570 0.336 0.803 0.892 ②≒①>③>④
Air conditioning environment mean 3.13 3.31 3.37 2.81 2.26 f=37.121**
Standard Deviation (S.D) 0.590 0.465 0.294 0.675 0.572 ②≒①>③>④

⁕p>0.00

Table 8.

Barber Shop Servicescape Level Evaluation by Educational Level (unit:%)


All By educational background
statistic (scheffe test)

less than high school ①
college graduate ②
college graduate or higher ③
n (200) (36) (52) (112)
All mean1) 3.17 2.11 3.38 3.40 f=136.682** (③≒②>①)
Standard Deviation (S.D) 0.64966 0.39514 0.49895 0.39152
Aesthetic mean 3.11 1.99 3.36 3.35 f=89.666** (②≒③>①)
Standard Deviation (S.D) 0.76004 0.53864 0.49991 0.57950
Convenience mean 3.16 2.11 3.39 3.39 f=88.013** (②≒③>①)
Standard Deviation (S.D) 0.71889 0.57459 0.60400 0.46646
Cleanliness mean 3.26 2.15 3.48 3.52 f=122.824** (③≒②>①)
Standard Deviation (S.D) 0.69960 0.40489 0.57981 0.42937
Air conditioning environment mean 3.13 2.19 3.28 3.36 f=126.486** (③≒②>①)
Standard Deviation (S.D) 0.59024 0.39916 0.50797 0.32350

*Evaluation scale: ① Not at all ② Not very much ③ Average ④ Somewhat ⑤ Very much

2) difference verification (anova test) : * (95% significance level), ** (99% significance level), ns (no significance)

Table 9.

Barber Shop Servicescape Level Evaluation by Income (unit:%)


All By monthly income
Statistic2) (scheffe test)

less than 2 million won ①
Less than 200 to 3 million won ②
Less than 300~400 million won ③
over 500 million won ④
n (200) (26) (68) (80) (26)
All mean1) 3.16 2.31 3.05 3.41 3.56 f=33.778** (④≒③>②>①)
Standard Deviation (S.D) 0.64966 0.73250 0.64168 0.41439 0.17854
Aesthetic mean 3.11 2.17 2.98 3.38 3.50 f=27.591** (④≒③>②>①)
Standard Deviation (S.D) 0.76004 0.66996 0.79842 0.53130 0.42855
Convenience mean 3.16 2.28 3.08 3.36 3.59 f=25.082** (④≒③>②>①)
Standard Deviation (S.D) 0.71889 0.87376 0.69683 0.52240 0.21304
Cleanliness mean 3.26 2.39 3.13 3.53 3.66 f=30.375** (④≒③>②>①)
Standard Deviation (S.D) 0.69960 0.81063 0.68864 0.47584 0.12634
Air conditioning environment mean 3.13 2.39 3.02 3.35 3.48 f=30.356** (④≒③>②>①)
Standard Deviation (S.D) 0.59024 0.72603 0.59833 0.34779 0.15689

*Evaluation scale: ① Not at all ② Not very much ③ Average ④ Somewhat ⑤ Very much

2) difference verification (anova test) : * (95% significance level), ** (99% significance level), ns (no significance)

Table 10.

Barber Shop Servicescape Level Evaluation by Marriage Status (unit:%)


All Marital Status
statistic2) (scheffe test)

single ①
married ②
Etc ③
n (200) 60 108 32
All mean1) 3.16 3.32 3.17 2.85 f=5.769* (①≒②>③)
Standard Deviation (S.D) 0.64966 0.50440 0.61785 0.87038
Aesthetic mean 3.11 3.29 3.08 2.85 f=3.718* (①≒②>③)
Standard Deviation (S.D) 0.76004 0.64221 0.72820 0.97883
Convenience mean 3.16 3.36 3.15 2.81 f=6.456* (①≒②>③)
Standard Deviation (S.D) 0.71889 0.59780 0.68185 0.91029
Cleanliness mean 3.26 3.39 3.30 2.92 f=4.991* (①≒②>③)
Standard Deviation (S.D) 0.69960 0.55209 0.68466 0.89010
Air conditioning environment mean 3.13 3.27 3.14 2.83 f=6.001* (①≒②>③)
Standard Deviation (S.D) 0.59024 0.47733 0.54674 0.80161

*Evaluation scale: ① Not at all ② Not very much ③ Average ④ Somewhat ⑤ Very much

2) difference verification (anova test) : * (95% significance level), ** (99% significance level), ns (no significance)

Table 11.

Servicescape level evaluation by barber shop type (unit:%)


All By type of barber shop
statistic2) (t-test)

Individual ①
Franchise ②
n (200) (162) (38)
All mean1) 3.16 3.08 3.53 f=5.769* (②>①)
Standard Deviation (S.D) 0.64966 0.67034 0.37470
Aesthetic mean 3.11 3.02 3.49 f=3.718* (②>①)
Standard Deviation (S.D) 0.76004 0.75810 0.64786
Convenience mean 3.16 3.08 3.50 f=6.456* (②>①)
Standard Deviation (S.D) 0.71889 0.73616 0.52633
Cleanliness mean 3.26 3.17 3.67 f=4.991* (②>①)
Standard Deviation (S.D) 0.69960 0.73104 0.31892
Air conditioning environment mean 3.13 3.04 3.49 f=6.001* (②>①)
Standard Deviation (S.D) 0.59024 0.60909 0.30886

Table 12.

Correlation Analysis of Barber Shop Servicescape, Customer Satisfaction, and Revisit Intention

Customer satisfaction Intention to revisit
Servicescape evaluation .781 (p=.000**) .618 (p=.000**)

1) correlation analysis : * (90% signifance level), ** (95% significance level), n.s (not significance)

Table 13.

Barber Shop customer satisfaction and revisit intention by age (unit:%)


All By age
statistic2) (scheffe test)

30's or younger ①
40's ②
50's ③
over 60 ④
n (200) (76) (68) (36) (20)
Customer satisfaction mean1) 3.26 3.48 3.36 2.96 2.55 f=21.476**
Standard Deviation (S.D) 0.60078 0.46701 0.35202 0.78929 0.63216 ①≒②>③>④
Intention to revisit mean 3.22 3.32 3.34 3.07 2.71 f=13.040**
Standard Deviation (S.D) 0.48404 0.44218 0.41436 0.51951 0.41378 ②≒①≒③>④

difference verification (anova test) : * (95% significance level), ** (99% significance level), ns (no significance)

Table 14.

Barber Shop Customer Satisfaction and Revisit Intention by Educational Background (unit:%)


All by educational background
statistic2) (scheffe test)

less than high school ①
college graduate ②
college graduate or higher ③
n (200) (36) (52) (112)
Customer satisfaction mean1) 3.26 2.35 3.55 3.41 f=102.179** (②≒③>①)
Standard Deviation (S.D) 0.60078 0.35669 0.47866 0.41500
Intention to revisit mean 3.22 2.67 3.25 3.39 f=42.484** (③≒②>①)
Standard Deviation (S.D) 0.48404 0.32497 0.42875 0.41918

*Evaluation scale: ① Not at all ② Not very much ③ Average ④ Somewhat ⑤ Very much

2) difference verification (anova test) : * (95% significance level), ** (99% significance level), ns (no significance)

Table 15.

Barber Shop Customer Satisfaction and Revisit Intention by Income (unit:%)


All by monthly income
statistic2) (scheffe test)

less than 2 million won ①
Less than 200 to 3 million won ②
Less than 300~400 million won ③
over 500 million won ④
n (200) (26) (68) (80) (26)
customer satisfaction mean1) 3.26 2.62 3.14 3.48 3.51 f=20.321** (④≒③>②>①)
Standard Deviation (S.D) 0.60078 0.86966 0.51523 0.44366 0.31885
Intention to revisit mean 3.22 2.67 3.15 3.34 3.58 f=24.845** (④≒③>②>①)
Standard Deviation (S.D) 0.48404 0.41994 0.42983 0.45916 0.11602

*Evaluation scale: ① Not at all ② Not very much ③ Average ④ Somewhat ⑤ Very much

2) difference verification (anova test) : * (95% significance level), ** (99% significance level), ns (no significance)

Table 16.

Barber Shop customer satisfaction and revisit intention by marital status (unit:%)


All Marital Status
statistic2) (scheffe test)

single ①
married ②
Etc ③
n (200) 60 108 32
Customer satisfaction mean1) 3.26 3.45 3.25 2.90 f=9.318** (①≒②>③)
Standard Deviation (S.D) 0.60078 0.46945 0.58343 0.72278
Intention to revisit mean 3.22 3.28 3.22 3.10 n.s
Standard Deviation (S.D) 0.48404 0.48814 0.44438 0.59037

*Evaluation scale: ① Not at all ② Not very much ③ Average ④ Somewhat ⑤ Very much

2) difference verification (anova test) : * (95% significance level), ** (99% significance level), ns (no significance)

Table 17.

Customer Satisfaction and Revisit Intention by Barber Shop Type (unit:%)


All By type of barber shop
statistic2) (t-test)

Individual ①
Franchise②
n (200) (162) (38)
Customer satisfaction mean1) 3.26 3.19 3.51 f=8.778* (②>①)
Standard Deviation (S.D) 0.60078 0.62225 0.41717
Intention to revisit mean 3.22 3.19 3.36 f=4.185* (②>①)
Standard Deviation (S.D) 0.48404 0.51230 0.30334

*Evaluation scale: ① Not at all ② Not very much ③ Average ④ Somewhat ⑤ Very much

2) difference verification (anova test) : * (95% significance level), ** (99% significance level), ns (no significance)